


In today’s fast-paced industrial and manufacturing environments, effective communication is key to maintaining operational efficiency and ensuring safety. Instrumentation, being central to controlling and monitoring processes, requires precision, accuracy, and real-time visibility for optimal performance. This is where Visual Management comes in — a strategy that leverages visual cues, displays, and indicators to make complex data accessible, organized, and easy to understand at a glance. For industries heavily reliant on instrumentation, visual management is a game-changer in organizing, standardizing, and continuously improving systems.
What is Visual Management?
Visual management refers to the use of visual signals such as charts, diagrams, color codes, displays, and symbols to communicate information quickly and clearly to all team members. By presenting data in a way that’s intuitive and easy to interpret, visual management helps people make faster decisions, reduce errors, and ensure smooth operation, especially in environments with complex instruments and controls.
In instrumentation, visual management is crucial for ensuring that control panels, gauges, meters, and sensor displays are easy to read and interpret. This ultimately supports operational efficiency, minimizes downtime, and fosters a more organized work environment.
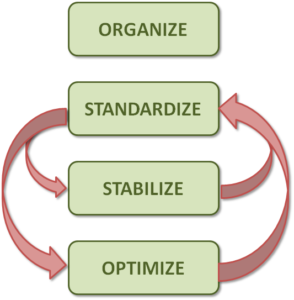
The Three Pillars of Visual Management in Instrumentation
1. Organize
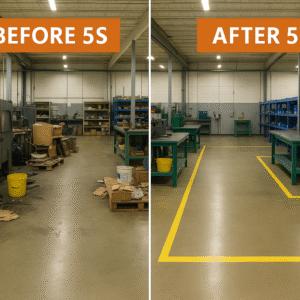
The first step in effective visual management is organization. A cluttered or disorganized instrumentation setup can make it difficult to locate and interpret critical information when it’s needed most. To avoid confusion and minimize errors, all instruments, controls, and displays must be arranged logically and consistently.
Organizing instrumentation involves grouping related equipment together, labeling components clearly, and ensuring that every control or display is positioned for ease of use. For example, a visual layout of valves, gauges, and controllers within easy reach of the operator reduces the time spent searching for critical controls during operations.
Organizing also includes standardizing color codes, symbols, and signage across the plant or facility. Standardization ensures that team members across different shifts, locations, or teams can instantly recognize key indicators such as warnings, operational status, or abnormal conditions, creating a uniform understanding of the system.
Example of Organizing Instrumentation:
- Use color-coded indicators (green for normal operation, red for critical issues) to highlight status across gauges and panels.
- Position displays in ergonomic locations where operators can easily monitor process performance without distraction.
2. Standardize
Standardization is the next vital component of visual management in instrumentation. When all instruments and control systems follow a consistent visual language, operators can become more familiar with the equipment and react faster to issues. Standardized displays reduce cognitive load, so operators don’t have to interpret different formats or symbols every time they look at a system.
One of the key goals of standardization in instrumentation is to establish uniform protocols for visual displays. Whether it’s the design of control panels, the use of meters, or alarm notifications, having a standard approach across all instruments can greatly reduce errors and misinterpretations.
For instance, when a particular sensor or display consistently uses the same color to signify a specific condition (e.g., red for high pressure), operators don’t need to decipher unfamiliar symbols or indicators every time. This consistency builds muscle memory and makes it much easier to identify issues quickly.
Example of Standardizing Instrumentation:
- Ensure all pressure gauges across various departments follow the same visual format with clear ranges, color coding, and labeling.
- Apply consistent symbols for on/off, open/closed, or start/stop across different control systems.
3. Improve
The ultimate goal of visual management is continuous improvement. Visual tools, when used effectively, can highlight inefficiencies, bottlenecks, or anomalies that would otherwise be difficult to identify. By using visual indicators, organizations can gain insights into performance, and this data can then be used to make informed decisions that lead to improvement.
In the context of instrumentation, improvement can be seen in various ways. One of the most significant benefits of visual management is its ability to track performance in real-time. Instrument displays that offer live data allow operators and managers to spot trends, assess performance, and make proactive adjustments before small issues escalate.
Moreover, the visual management approach encourages a culture of problem-solving and accountability. When performance data is visible to everyone, it fosters transparency and motivates teams to work together to improve processes. Through the systematic use of visual cues, operators and technicians can detect inefficiencies early and address them through targeted solutions.
Example of Improvement Through Visual Management:
- Using visual dashboards to display real-time operational metrics, such as flow rate or temperature, which can alert operators to deviations and potential maintenance needs.
- Implementing visual performance indicators that track downtime, enabling teams to pinpoint areas for improvement in machine or system reliability.
Benefits of Visual Management in Instrumentation
Implementing visual management in instrumentation has several advantages, including:
- Increased Efficiency: Operators can easily monitor systems at a glance, which helps reduce response time in emergencies and minimizes downtime.
- Improved Safety: Clearly visible warning signs and indicators help operators act quickly in case of hazardous situations, preventing accidents and equipment damage.
- Enhanced Communication: Visual tools improve communication across shifts and departments by providing a clear, consistent understanding of system status.
- Reduced Training Time: New operators or technicians can quickly familiarize themselves with the instrumentation, as visual management removes much of the guesswork.
- Greater Process Control: By continuously monitoring processes with visual management, teams can stay ahead of problems, improve workflows, and optimize overall performance.
Conclusion
Visual management in instrumentation is an essential practice that contributes to a more organized, standardized, and efficient work environment. By implementing visual cues, displays, and indicators across instrumentation systems, organizations can streamline operations, improve communication, and empower teams to make faster, more informed decisions. The ultimate result is an enhanced ability to track, control, and improve performance, which not only maximizes productivity but also creates a safer and more collaborative workplace.
By organizing, standardizing, and continuously improving through visual management, industries can ensure that their instrumentation systems support optimal functionality, reduce risks, and promote long-term success.